
SysGauge のスクリーンショット
<1> 初回起動時 - 無料版の使用制限

<2> System Status

<3> CPU Monitor

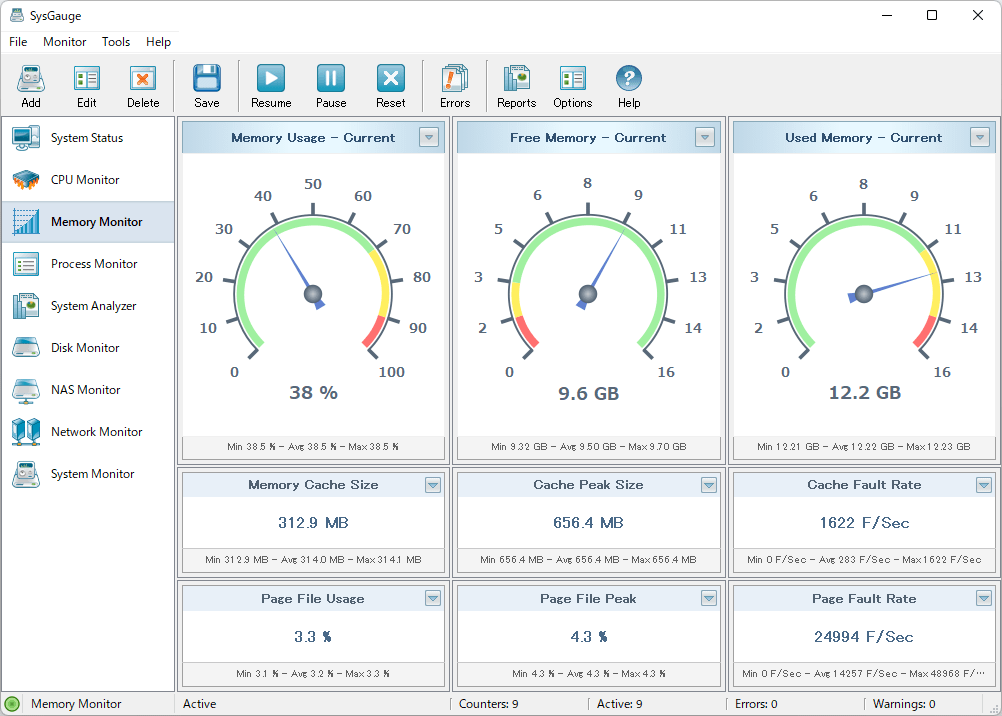
<4> Memory Monitor
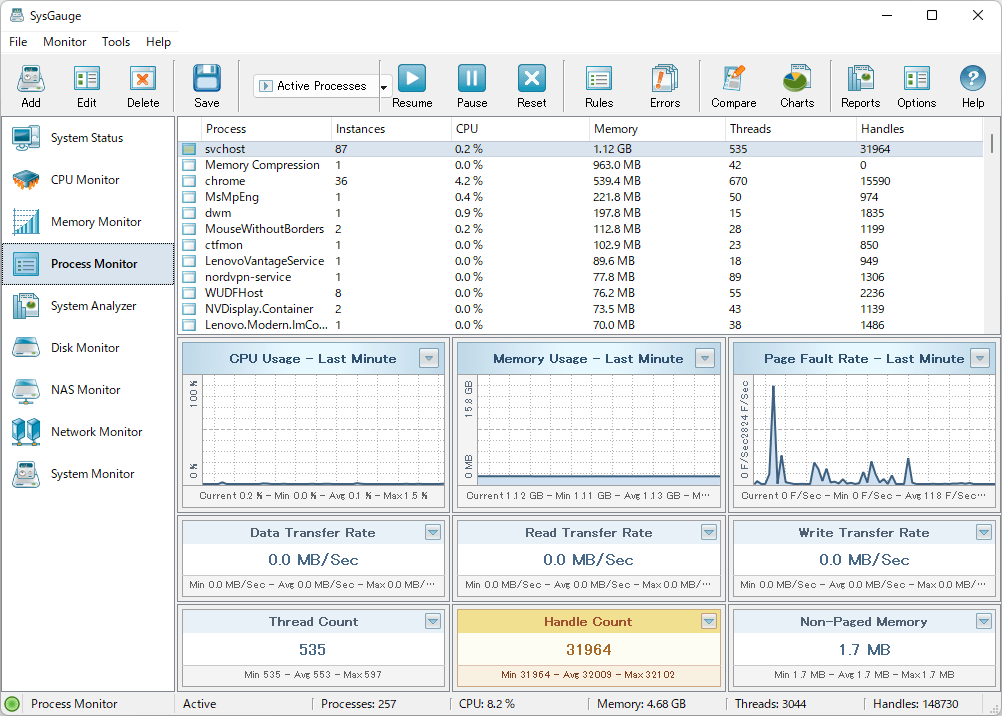
<5> Process Monitor
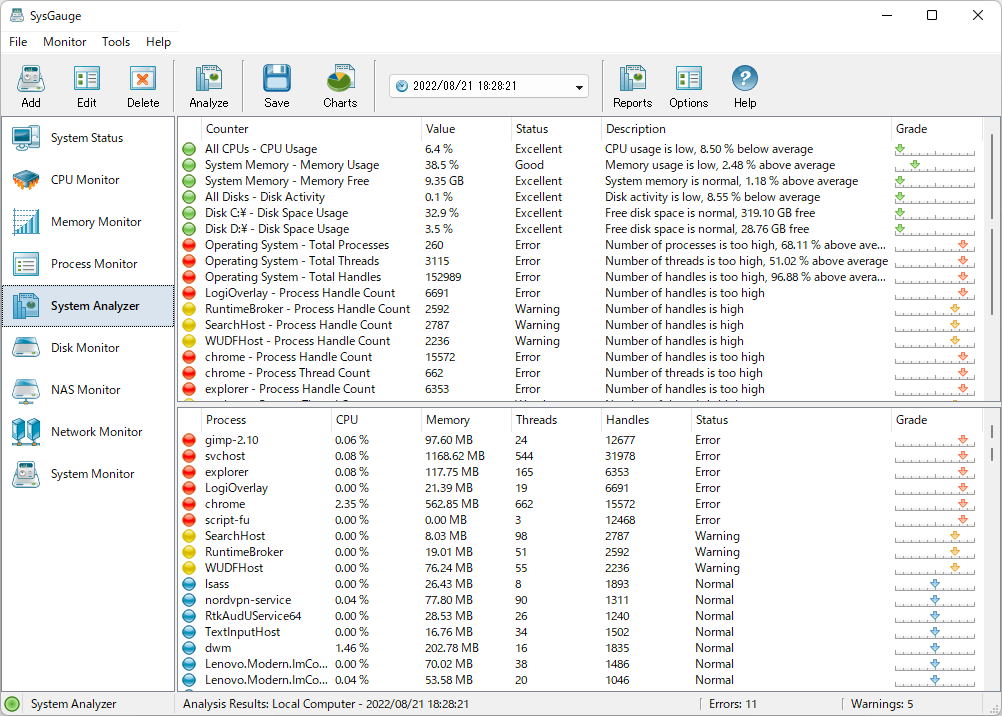
<6> System Analyzer
<7> Disk Monitor

<8> NAS Monitor

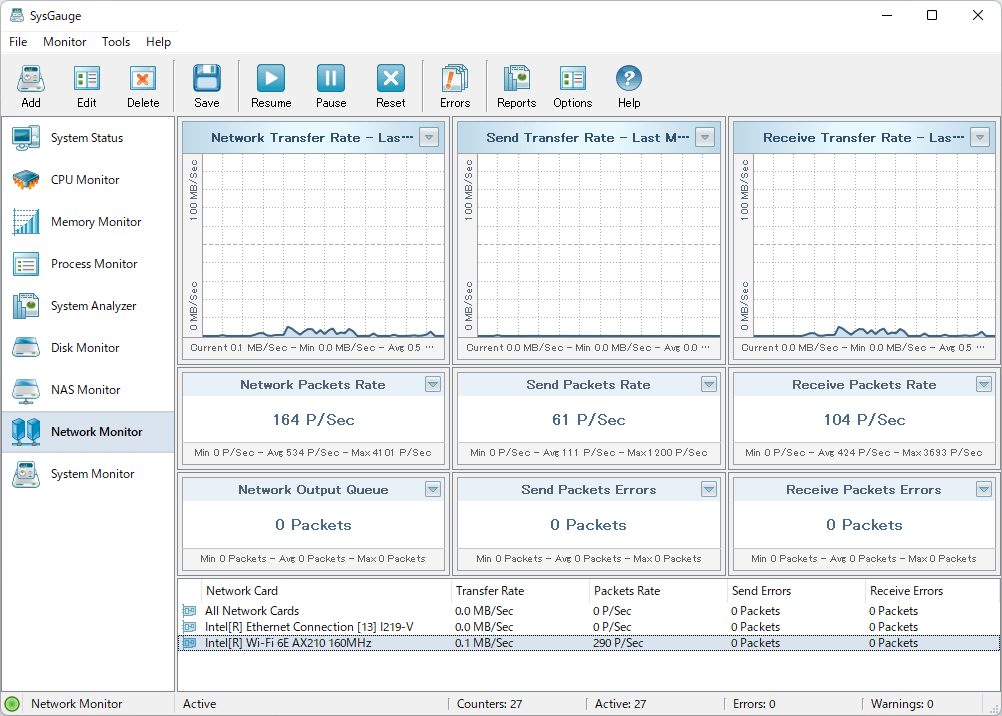
<9> Network Monitor
<10> System Monitor

<11> モニターを追加

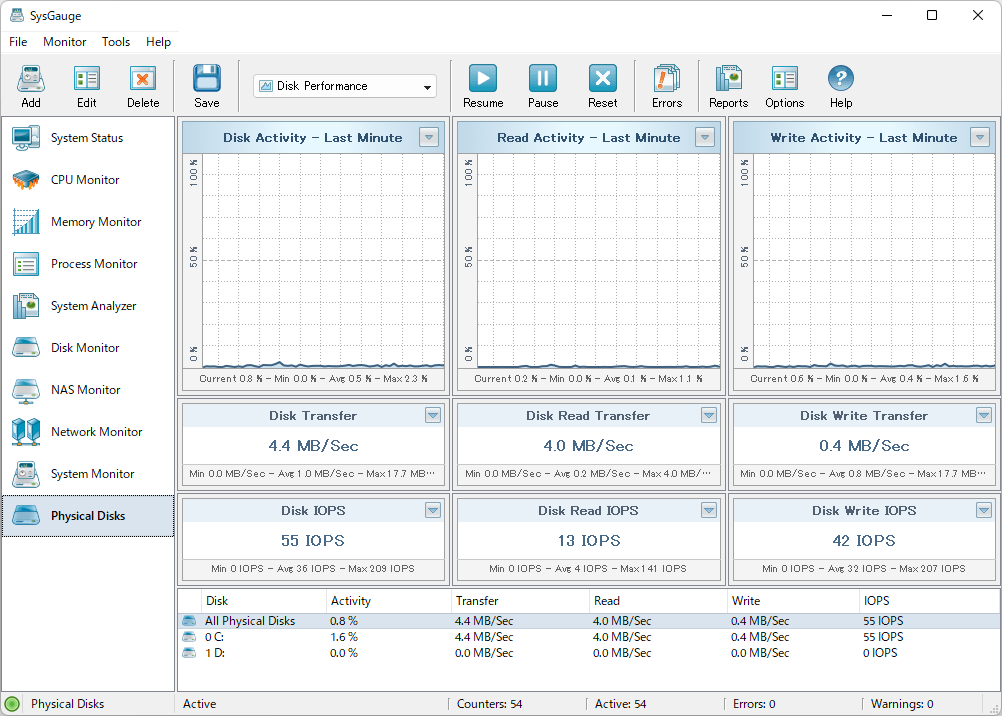
<12> Physical Disks が追加された
<13> 個別項目のメニュー

<14> 個別項目のメニューから「View Counter Charts」をクリックして表示

<15> レポートを保存

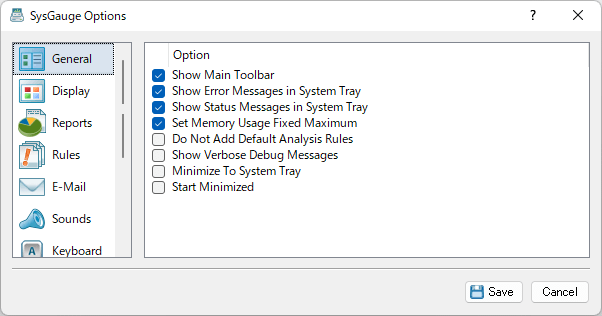
<16> 「Tools」⇒「Advanced Options」
<17> 掲載しているスクリーンショットのバージョン情報

